System Intelligence
A comprehensive health check for your browser and device -- no installation required
Launch System Intelligence →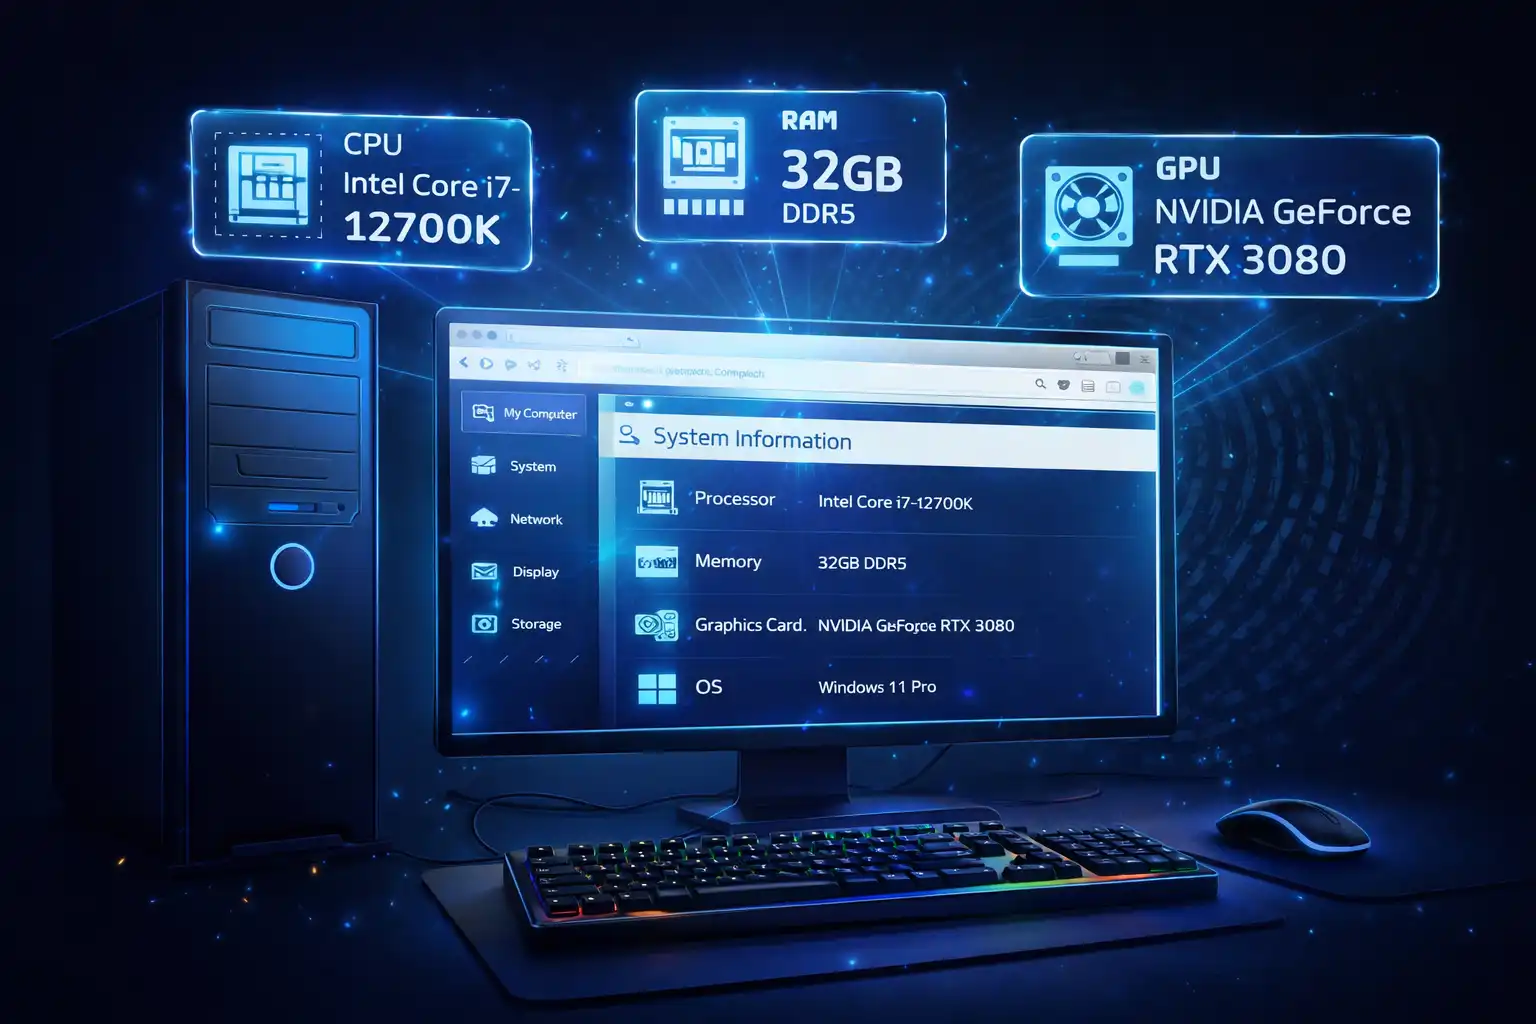
Table of Contents
Overview
The System Intelligence Platform is a privacy-first web application that displays detailed information about your device, browser, and system capabilities. Think of it as a comprehensive health check for your web browser -- showing everything from CPU cores and GPU information to battery status, network speed, storage usage, media capabilities, sensor support, and security features. All of this is gathered and displayed entirely within your browser, with nothing ever sent to a server.
The platform presents 12+ categories of system information through a clean, card-based interface with gradient icons, color-coded progress bars, and collapsible content sections. You can search and filter information in real-time, sort cards by name, switch between grid and list layouts, and toggle between dark and light themes. The sidebar provides quick navigation to any category, and keyboard shortcuts allow power users to work efficiently.
One of the standout features is the snapshot system, which lets you save your system state at any point in time and compare it later. This is valuable for tracking changes over time (such as battery degradation), performing before/after comparisons after system updates, or documenting system configurations for troubleshooting or support tickets. All snapshots are stored locally in your browser and can be exported in five formats: Clipboard, JSON, CSV, Text, and PDF.
Key Features
12+ Information Categories
Browser details, operating system, hardware specs, battery status, network info, storage and quota, media capabilities, sensor support, performance metrics, security features, advanced APIs, and input devices.
Snapshot & Comparison
Save your system state at any moment and compare snapshots over time. Color-coded differences show what increased (green), decreased (red), or changed since your last snapshot.
5 Export Formats
Export your system information as Clipboard text for quick sharing, JSON for developers, CSV for spreadsheets, plain Text for documentation, or professional PDF reports with progress tracking.
Real-Time Search & Filter
Instantly find any piece of system information with the search bar (Ctrl+K). Results update in real-time, matching card titles, property names, and values. Filter and sort cards by name or default order.
Grid & List Views
Switch between a responsive card grid layout and a stacked list view. Sort cards alphabetically (A-Z or Z-A) or keep the default categorized order for easy scanning.
Color-Coded Progress Bars
Visual indicators for battery level (green/yellow/red), storage usage (blue/amber/red), and memory metrics help you understand your system status at a glance without reading numbers.
Dark & Light Themes
Toggle between dark and light themes with the theme button or Ctrl+D shortcut. Your preference is automatically saved to localStorage and persists across sessions.
Keyboard Shortcuts
Power-user keyboard shortcuts: Ctrl+K for search, Ctrl+D for theme toggle, ? for help, Esc to close modals, and Tab for modal navigation. Work faster without touching your mouse.
How to Use
- Open the Application - Visit System Intelligence in your browser. A loading animation appears briefly while the app gathers your system information (1-2 seconds). No installation or account is needed.
- Browse Information Cards - The main content area displays your system data in organized cards with gradient icons. Each card shows key-value pairs, progress bars, and collapsible sections. Click any card to expand its details.
- Search for Specific Data - Press Ctrl+K to focus the search bar, then type any term (e.g., "battery", "chrome", "mp4", "wifi"). Matching cards are highlighted in real-time while non-matching cards are hidden.
- Take Snapshots - Find the Snapshots section in the sidebar and click "Take Snapshot" to save your current system state. Take multiple snapshots over time to track changes in battery health, storage usage, or performance metrics.
- Compare Snapshots - Hover over any saved snapshot and click "Compare" to see color-coded differences between that snapshot and your current system state. Green indicates increases, red indicates decreases.
- Export Your Data - Click the Export button in the header and choose from five formats: Clipboard for quick pasting into emails or chat, JSON for developers, CSV for Excel or Google Sheets, Text for simple documentation, or PDF for professional reports.
- Customize Your View - Toggle between grid and list layouts, sort cards alphabetically, switch between dark and light themes (Ctrl+D), and adjust settings like auto-refresh intervals and data retention policies.
Frequently Asked Questions
Privacy & Security
System Intelligence is built on the zero-data-upload principle. All system information is gathered using standard browser APIs that run locally on your device. No data is transmitted to any external server, no analytics or tracking cookies are used, and no user accounts are required. Your snapshots, settings, and exported data remain under your complete control. The application works fully offline after the initial page load, and every piece of information displayed stays exclusively in your browser's memory and localStorage.
Ready to try System Intelligence? It's free, private, and runs entirely in your browser.
Launch System Intelligence →Related

Last Updated: February 28, 2026